

What a percentage really tells you
It is easy these days to find headlines that promise to know how the league will end: predictions made by “supercomputers”, based on big data and on “millions of simulations”. It sounds like an exact science. But what does all that mean? Where does the percentage they give your team come from? Is it for knowing what is going to happen, or for something else? We start with the questions and answer them in the following sections.
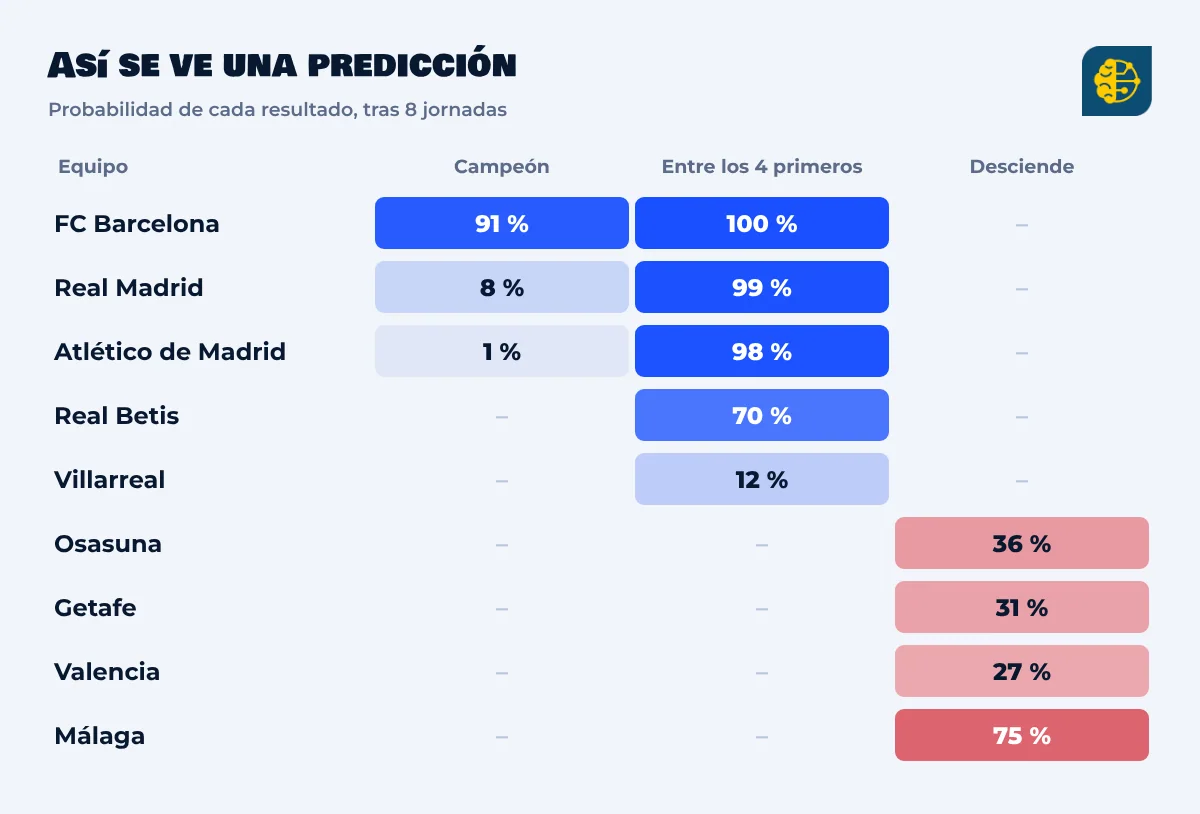
Illustrative example of a prediction, with approximate figures.
A league-table prediction does not tell you how the league will end: it tells you in how many different ways it could end.
Every time you read that a team has a 70% chance of finishing in Europe, or a 1% chance of going up, behind it there is a spread of probabilities, not a sentence. The problem is that this spread almost always reaches the fan turned into a headline, and a headline needs a protagonist: “the favourite”, “the relegation candidate”, “the one who is already safe”.
In this article we will see how these figures are calculated, why they are worth less than they seem for guessing the future and what they can really be useful for. The idea we want you to take away is simple: normally, a prediction does not measure the future, it measures how open the competition is at this moment.
What a Monte Carlo simulation is
“Monte Carlo” sounds like a casino and a technical term, but behind it is a statistical method that is easy to understand. It is the method used in many of the simulations you see on social media, in the media and at some football data providers. That is why it is worth knowing what it does: that way you will understand what they are telling you when they give you a percentage.
A Monte Carlo simulation consists of playing the season many times on a computer and counting what happens.
You start from an estimate of how strong each team is and “play” every match that is left. But you do not play it just once: in each match the computer rolls the dice with the probabilities of a win, draw and defeat, and the result changes from one simulation to another. Each simulated season ends with a different table. This is repeated 1,000, 10,000 or 100,000 times and you count: in how many does team A finish as champion, in how many does it get into Europe, in how many is it relegated. That count is the origin of the percentages you see published.
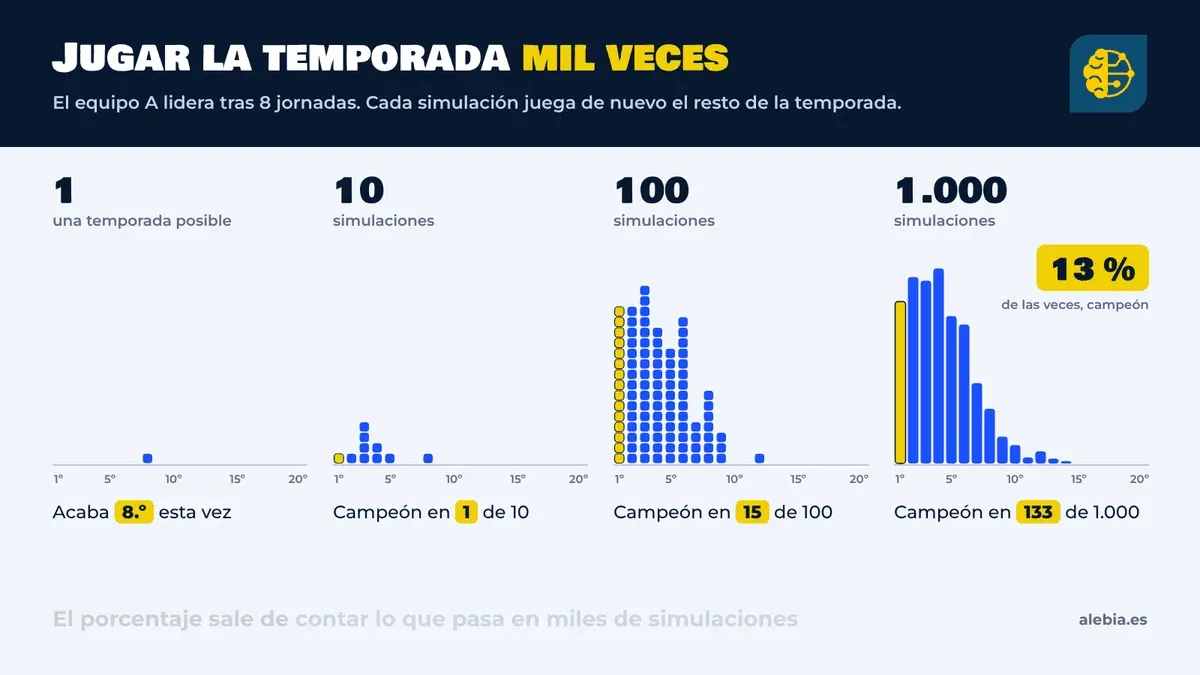
Notice what it does not say. With a single simulation, team A in our example finishes eighth. With a thousand, we see that it wins the title in about 13 out of 100, that the most common outcome is a finish between second and sixth, and that there are much worse endings. The answer is not a position, it is a spread.
Two caveats about what you hear around. Whether it is a thousand or ten million simulations only refines the count: it does not make the model know more about football. And to simulate a league you do not need a supercomputer: what counts is the model of how each match is played.
An aside: this kind of prediction is often called big data. It is not. We will talk about that another day.
Why they are worth less than they seem
Football has so much randomness that it limits any prediction, however good.
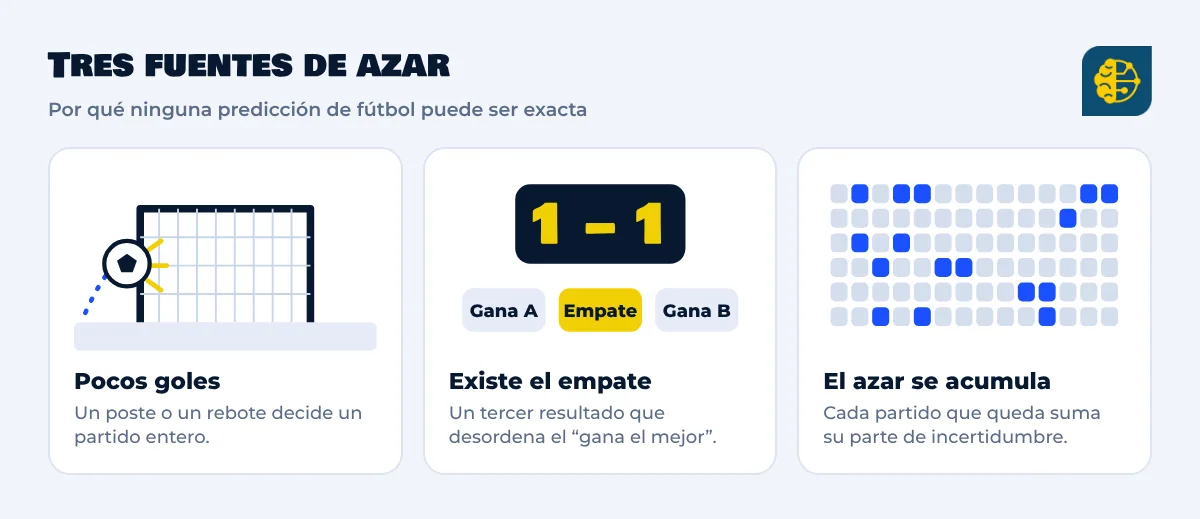
- Few goals are scored. A post, a rebound or a penalty can decide a whole match. The result depends more on isolated actions than in sports where a lot is scored.
- The draw exists. A third result, which shares out points and upsets the idea that the best team always wins.
- Uncertainty accumulates. With 30 matchdays to go there are about 300 matches left to play, and each adds its share of chance.
That is why a model can be well made and still “fail” frequently. An 85% chance of being champion means that, out of every 100 similar seasons, in about 15 someone else wins. If you only play once, you may get that one.
Where they usually fail
The most common failures are not in the calculation, they are in the approach.
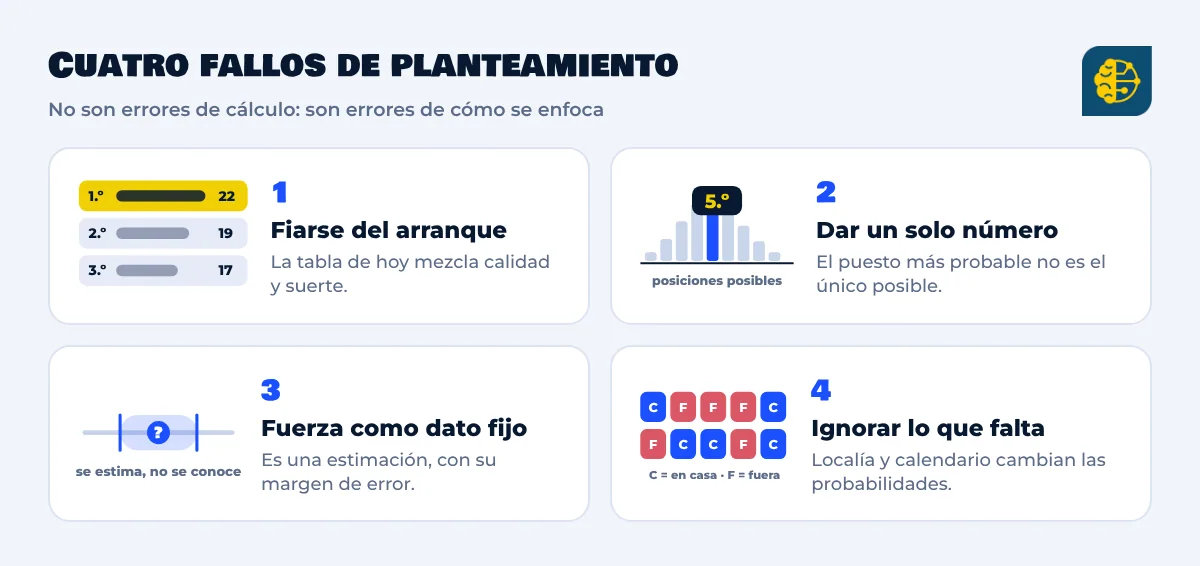
- Trusting the start of the season too much. With few matchdays played, the table mixes quality and luck, and it is hard to separate them. A team with 22 points after 8 matchdays may be very good, or may have had an easy schedule and a few results going its way. If a model gives a lot of weight to those points, it quickly assigns a very clear favourite.
- Giving a single number. Saying that a team will finish fifth hides the fact that it may have real chances of finishing second and of finishing tenth. The most likely position is not the only possible one.
- Treating each team’s strength as a fixed figure. Strength is not known: it is estimated, and that estimate has its own margin of error. A model that uses it as if it were exact looks more certain than it should.
- Ignoring what remains to be played. It is not the same to have several matches against direct rivals ahead, or many away games in a row, as a comfortable stretch. The schedule and home advantage change the probabilities.
How it could be done better: scenarios, not just strength
A good prediction treats a team’s strength as a fan of scenarios, not as a number.
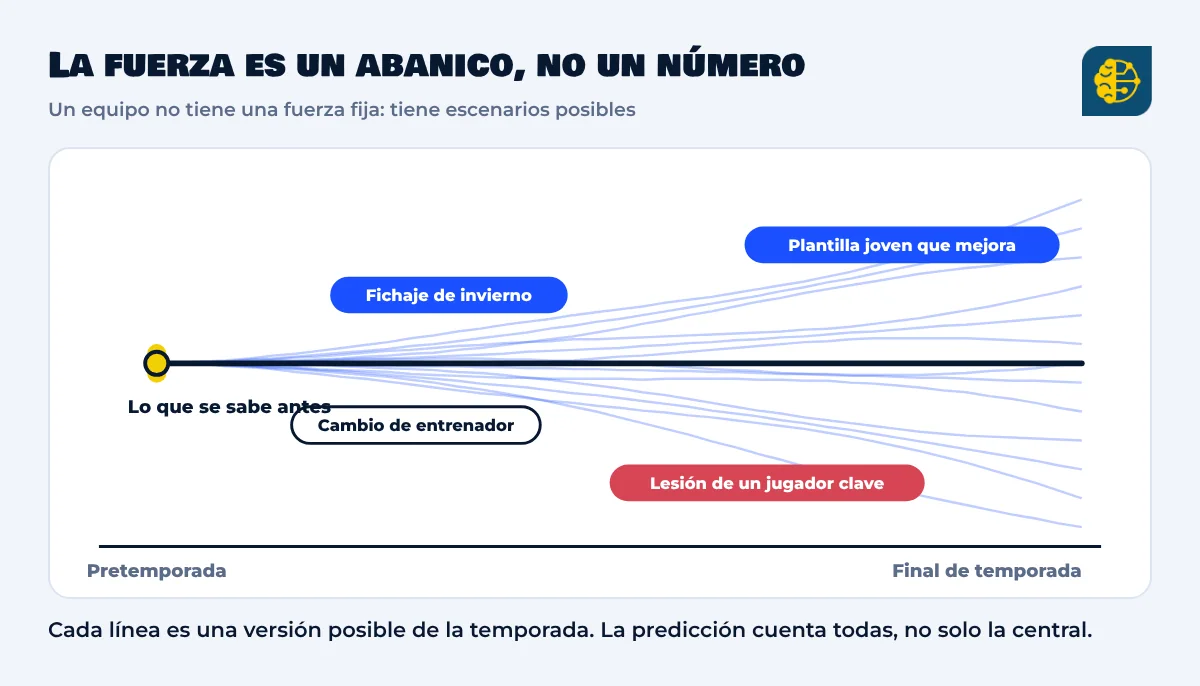
- Start from what is known before playing. Previous seasons, squad, manager. And update gradually with what happens, without throwing away everything that came before after five matchdays.
- Also simulate how that strength can change. An injured striker, a winter signing, a change of manager, a young squad that improves during the year. A team’s potential is not the same in September as in March, and every simulation should reflect it.
- Show ranges and probabilities, not a single position. The probability of finishing in each position counts for more than “they are expected to finish fifth”.
- Check whether it gets it right. If a model says “30%” many times, it should come true around 3 times out of 10. This is called calibration, and it is the most honest test that a set of percentages is worth anything.
None of this guarantees picking the champion. What it guarantees is that the uncertainty is told properly.
Three cases to read calmly
A single season proves nothing about a model, but it helps to understand how to read them. These are illustrative examples, with rounded figures.
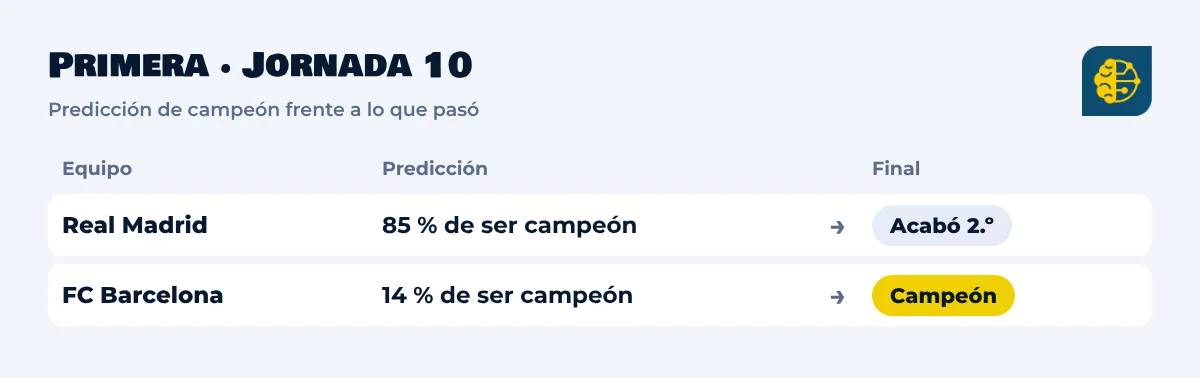
LaLiga 25/26 · Matchday 10
Real Madrid led by about five points and appeared with close to an 85% chance of being champion. Barcelona had around 14%. Barcelona ended up winning. It is not a failure of the model that 85% did not come true: it is what happens, more or less, one time in seven.
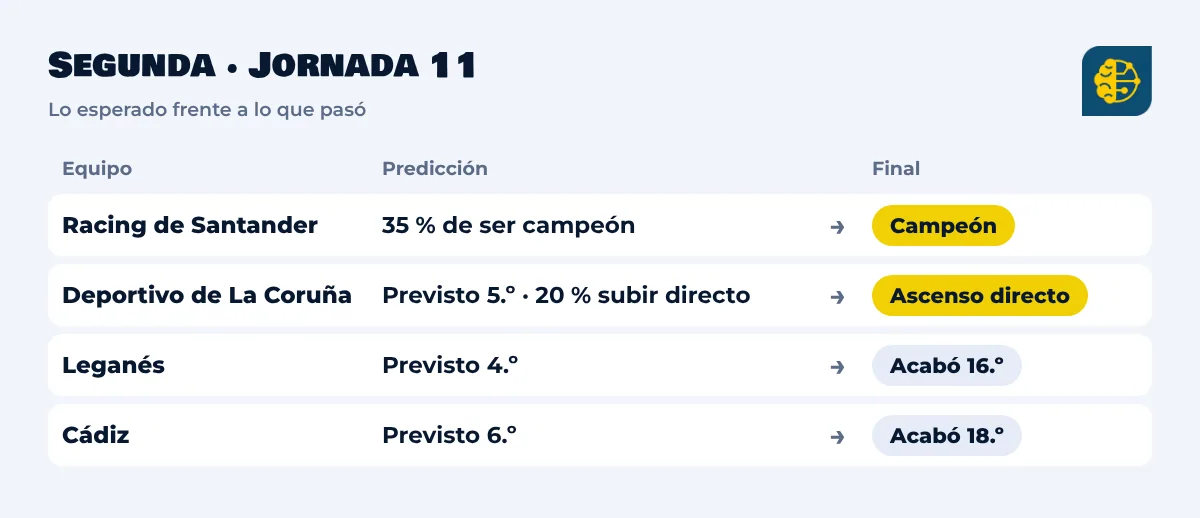
LaLiga Hypermotion 25/26 · Matchday 11
Racing de Santander led and had around a 35% chance of being champion. It finished first. But the second direct promotion went to Deportivo de La Coruña, which that day was fourth in the table and, by expected points, appeared fifth. It had close to a 20% chance of finishing in the top two: one in five. And conversely, Leganés, expected to finish fourth, ended sixteenth, and Cádiz, sixth in the forecast, ended eighteenth.
Here the problem of the single position can be seen. The expected order left the second promoted team off the podium, and the probabilities said something different: that it had real chances.
Before kick-off: August 2022
Before the 2022/23 season, some predictions gave Real Madrid a little over a 58% chance of being champion and Barcelona close to 19%. Barcelona won. Among the relegation candidates were Girona, with almost 40%, and Valladolid, with a little over 33%. Valladolid went down; Girona survived, and so did Mallorca, which was ranked as the bottom side.
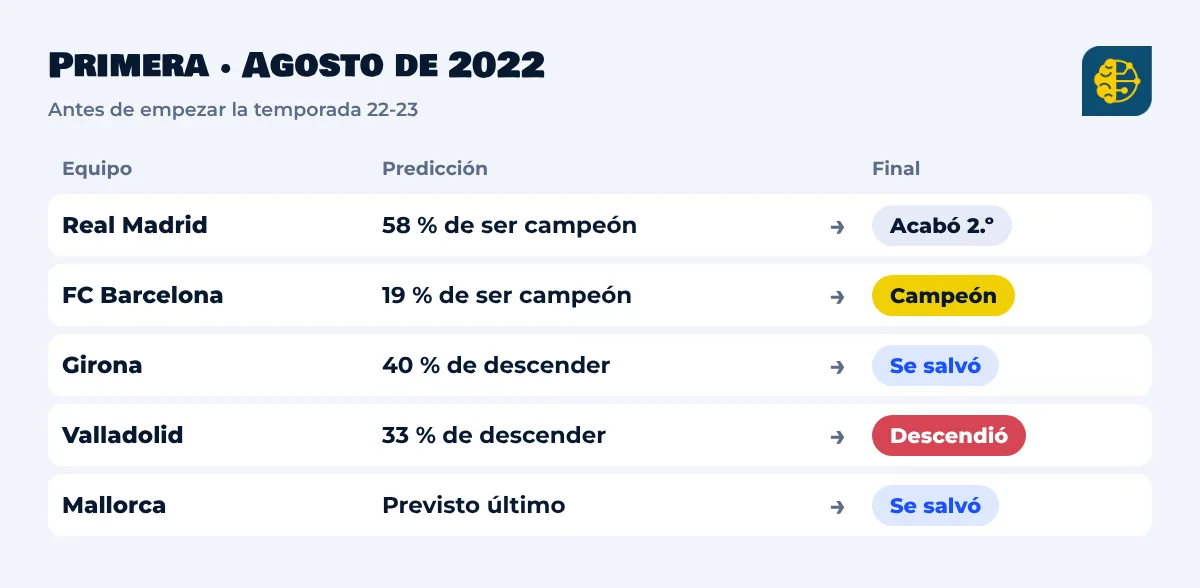
In none of the three cases was the result impossible according to the published figures. What failed was reading the favourite as a fact.
And today, after eight matchdays, there are predictions going around that give the First Division leader more than a 90% chance of being champion. We will see in May, but what is useful is to understand now what that number means.
What they are really for, and how to read them
A league-table prediction serves to measure how open a competition is, not to know who will win.
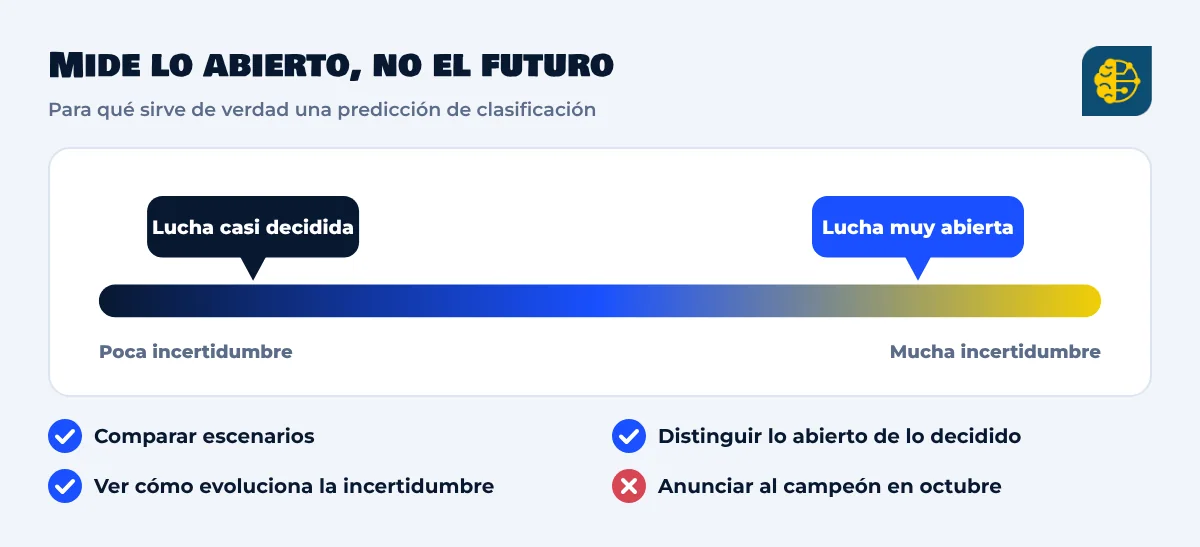
It serves to compare scenarios (what changes if they win the next match?), to tell a truly open fight from an almost decided one and to see how uncertainty evolves over the year. It does not serve to announce the champion in October.
If you want to read one without being fooled, ask it three questions:
- How much weight does what has already happened carry? With few matchdays played, a prediction that relies mostly on today’s table is reading more luck than quality.
- Does it give you ranges or a single number? A good prediction tells you the probability of each position, not just the most likely one.
- Does it take into account what remains to be played? It is not the same to have direct rivals ahead and several away games in a row as a comfortable home stretch. If the model treats all the remaining matches the same, the percentage is simpler than it looks.
A 1% chance is not impossible and a 90% chance is not certain. What matters is understanding what the numbers tell, not treating them as a sentence.