

WE DESERVED MORE
How many times will we have heard in a press conference or interview those much-repeated tags and clichés such as “A draw would have been fair”, “we earned a point or two”, “the result was unfair” or “the ball just didn’t want to go in”. It never fails, every matchday, one of football’s things. What leads players and coaches to make this kind of statement? Sometimes it is a message of optimism, of self-protection, of recognising the effort of your players, even though the play has not been rewarded by the result. On occasion these words are the product of an impulse, still in the heat of the moment, of a subjective interpretation of their team’s play. Or, why not, an attempt at objective analysis of what happened during the 90 minutes. A complex exercise in which many variables intervene, but where we believe that humans, passions aside, usually get it right.
In this article we are going to give a little more objectivity to these merits of each Segunda División team.
MERIT BASED ON CHANCES, EXPECTED GOALS
To simplify, when we hear or say this kind of statement, the basis of the argument is: my team had more chances, or clearer ones, and therefore we deserved to win. Counting chances is not a difficult task; there are usually few, although we tend to remember only the clearest. What is not so easy is to tell which chance was clearer and by how much. Are there statistics that help us weight each of the chances that occur in a match? The answer is yes: the already famous expected goals (xG).
xG is an advanced metric that assigns a probability of scoring to each of the chances in a football match. It gives information on the quality of the goal-scoring opportunity. For example, a penalty may have an xG of 0.78, which means that the probability of scoring from a penalty is 78%. This probability is calculated on the basis of different variables: the position of the shot, the angle, the goalkeeper’s position, and so on. Many data providers offer this metric in their tools.
MERITOCRACY
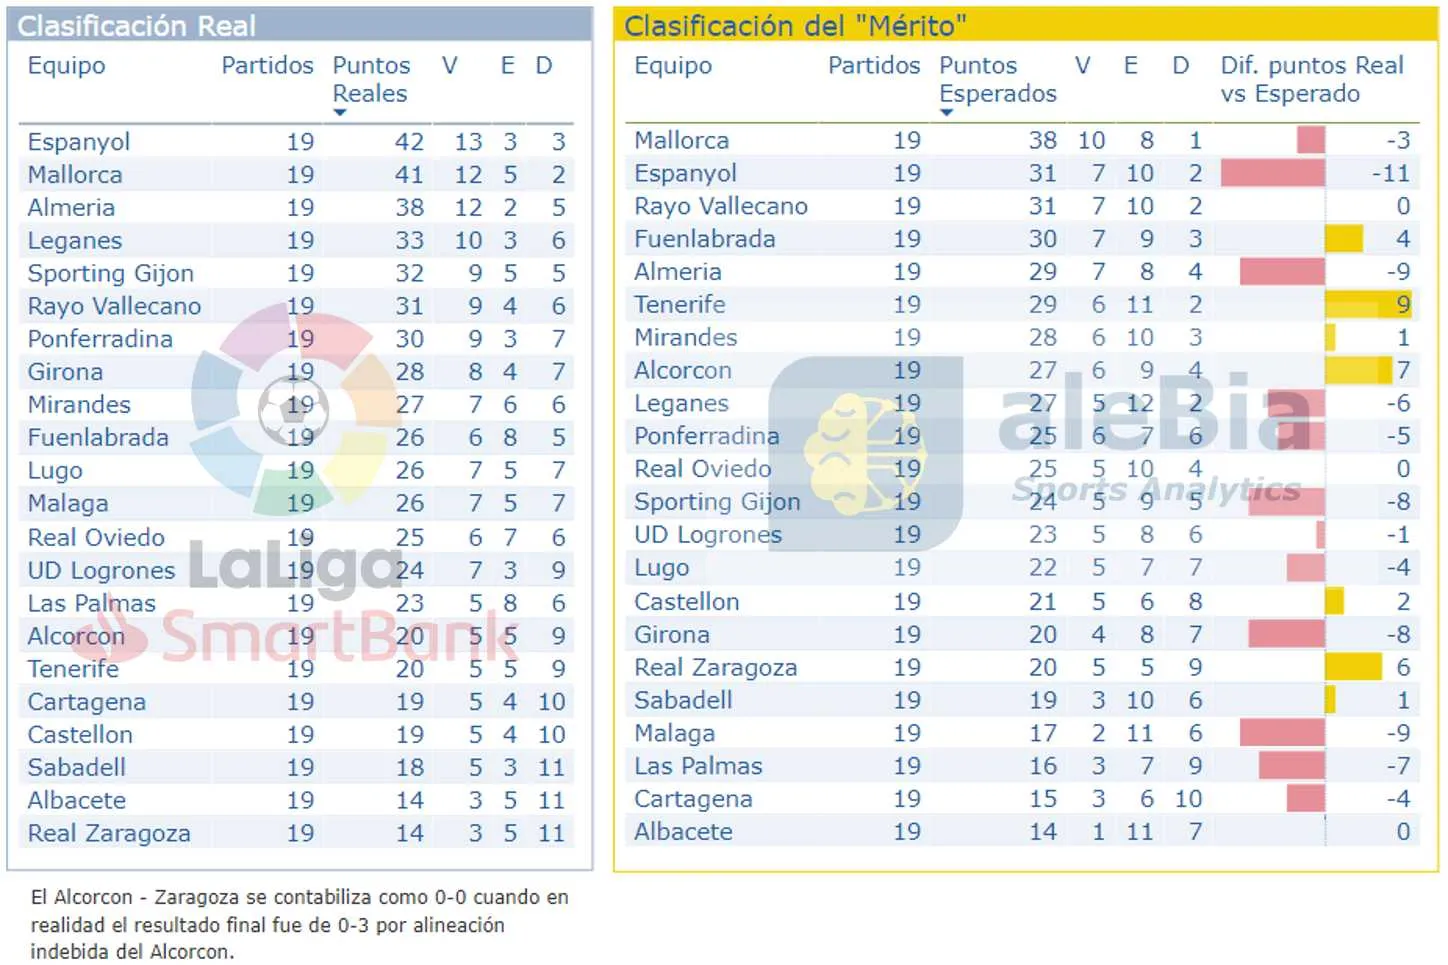
Let’s get to the point and try an exercise in meritocracy, from the Latin “due reward”. We will try to build a merit table based on the expected goals of each team in each of the 19 matchdays played in the Segunda División. From a team’s expected goals and its opponent’s in a match, we have calculated, with a simple regression model, the expected result of that match. The result of this exercise is the Merit Table that we have produced at Alebia Sports Analytics for the Smartbank league:
EFFECTIVENESS, THE KEY
Before analysing some of the differences seen in the table compared with the real points, let us see what a negative or positive difference between real and expected goals can mean. With this technique we can say that we remove, to some extent, the luck, good or bad, that a team may have had in the different matches. With the Merit Table, it could also be said that it is a way of measuring the degree of effectiveness in front of goal and also the success of the defences and, above all, of the goalkeeper. Why can a team have more expected points than real ones, or vice versa? A matter of luck and effectiveness. A team may have really good strikers and be more accurate than average. The strikers may be on a good run, or the team may have very reliable goalkeepers. Let’s analyse team by team.
WHAT YOU EAT IS WHAT YOU’RE SERVED
We could say that a total of 7 teams, based on this exercise, have obtained the points they deserve. Castellón, Mirandés, Sabadell, Albacete, Real Oviedo, Rayo Vallecano and UD Logroñés are in this position. These teams, over the 19 matchdays, have created and conceded chances in each match sufficient to earn the points they currently have. It is possible that in some matches they deserved more, but that has been offset by others in which they did not do enough to earn the points they ended up taking. These teams have, at most, a difference of 2 between real and “deserved” points, and their position in the Merit Table is hardly altered.
The fans of these teams cannot complain of bad luck (refereeing decisions aside) or of having players, across the squad as a whole, who have been clearly below what was expected. The points they have are in line with their merits.
MÁLAGA and TENERIFE, EXTREME CASES
The most striking cases in the Merit Table are those of Málaga and Tenerife. Both sides have a difference of 9 between real and “deserved” points, but with opposite analyses. It will be interesting to follow these two teams in the second half of the championship.
On the one hand, the Canary Islands side would rise as many as 11 places in the hypothetical table. It is one of the teams with the greatest difference between real goals and xG. Based on the chances created, it has earned the right to score 21 goals, yet it has only 15. In addition, it is the sixth team to take the most shots and one of those that concede the fewest. It has no strikers or players who make the difference in front of goal. Bermejo and Fran Sol are the top scorers with just 3 goals.
At the other extreme is Málaga. The Andalusian side would drop into the relegation places if the league table were decided by chances created or conceded. It would go from counting 7 wins to just 2. All the wins it has achieved have been by the narrowest of margins, except in one match. By contrast, 5 of its 7 defeats have been decided by a difference of 2 or more goals. Together with Espanyol, it can be said that Málaga is one of the most result-driven teams in the category, the one that gets the most out of its goals.
ALMERÍA, ESPANYOL, LEGANÉS AND MALLORCA, EATING AT A SEPARATE TABLE
The pools at the start of the season had the recently relegated sides as clear favourites, among them Espanyol, which was not rated. Almería joined this group of favourites, given the investment behind it and last year’s good season. In this sense, the league is having very few surprises. The promotion candidates are meeting expectations.
Espanyol and Almería are among the most effective teams. In this exercise it is usual to find that the teams at the top make the most of their chances and therefore have more points than their play may show. Obviously, they tend to have the most decisive players. The Periquito side is the team that creates the most danger and has Raúl de Tomás to take advantage of it. In addition, it can speculate with the result, go ahead and leave, to a certain extent, the initiative to its opponent. Having Diego López in goal also helps. Something similar happens with Leganés, although its profitability is not as exaggerated. Part of the credit goes to Pichu Cuéllar and his defence; it is among the teams that concede the fewest.
Mallorca’s data may suggest a more solid model of play. The “Meritocracy” gives it only 3 points fewer than expected, which would give it the lead, 7 points clear of the second. It is a team that scores what it has to score, but it is the team that faces the least danger.
DEPENDENT ON THEIR EFFECTIVENESS
Alcorcón, Fuenlabrada, Real Zaragoza, Cartagena, Lugo, Ponferradina, Girona, Las Palmas and Sporting. All of these teams swim between effectiveness and lack of it, but in a more restrained way than in the extreme cases we discussed earlier.
Alcorcón, Fuenlabrada and Zaragoza are in the group of teams that produce good play but have a significant imbalance in front of goal, or that have been naive in each of their penalty areas. It is to be expected that some of these teams will climb the table in the second half. This brief analysis based on the chances created can give a slight push of optimism for the future. Fuenlabrada, for example, is the third team to accumulate the most shots and xG in these 19 matchdays.
On the opposite side are, among others, Girona, Las Palmas and Sporting. These are teams that make great use of their chances or minimise those they concede. In the case of the Asturians, one of the main culprits for this effectiveness is Djurdjević. Sporting scores just enough thanks to the Serbian and is one of the teams that concede the fewest. If it goes ahead on the scoreboard, it is hard for it to lose the match. We will be watching to see whether Uroš manages to maintain his level, and attentive to how the team manages its Uroš-dependence in its offensive record.
A peculiar case is that of Girona, with very few goals scored and a big difference between xG conceded and goals against. It has a goal difference of -1 despite being in eighth place. Part of the explanation may be the great work Juan Carlos is doing between the posts. It may be a symptom that it also speculates with the result and concedes too much once ahead on the scoreboard. It is the second team to face the most shots in the category. Stuani is not at the level of other seasons, and although the normal thing is for his statistics to improve, the Catalan side may be walking a very fine wire.
Las Palmas is the second team that creates the least risk after Málaga, but it is nevertheless the team that has got the most return from its chances, having scored 7 goals more than expected. Rober and Araujo have scored 4 goals each when in reality they have created chances for just 4 goals between the two of them.
At Cartagena the stand-out name is the indestructible Rubén Castro, with one of the best, if not the best, effectiveness in the championship.
Finally, Lugo and Ponferradina have numbers that merit what they have. Good management in some matches has tipped the balance their way in a competition that is already very evenly matched, where every detail counts.
A NON-DEFINITIVE ANALYSIS
To finish, being honest, the expected result calculated from each team’s xG is far from being a fully rigorous calculation. The calculation is based on the xG accumulated over a whole match without taking into account the course of the game itself, although reinforced by other statistics. It has not taken into account which team went ahead on the scoreboard, at what moment, or what changes of score occurred during the match. To take a case in point, in the last Madrid derby, Atlético obtained higher xG than the Merengues, yet there is unanimity that Real Madrid “deserved” to win that match. The Madrid side went ahead on the scoreboard and had no need to create much more danger.
In short, there are match-level statistics that shed light on your team’s play and chance creation, allowing an analysis that goes beyond the result. Good use of them can help you begin to understand the potential and the objectives your team can have in a competition. In addition, the predictive model created can be reinforced with other variables that make it less aggressive and less dependent on xG. In any case, this analysis based on match statistics will give rise to other questions that will be answered in a deeper analysis with thorough contextualisation of each match.
We believe that this simple exercise we have carried out is a good example of the start of a continuous process of knowledge discovery: how, by analysing, answering questions, discovering, redefining, training and analysing again, we gain broader knowledge and, as a result, better information to make better-judged decisions.
Alebia Sports Analytics is your ideal signing to get the most out of your data. Together we will travel the road to success, with simplicity, speed and pragmatism. Get in touch with us!