

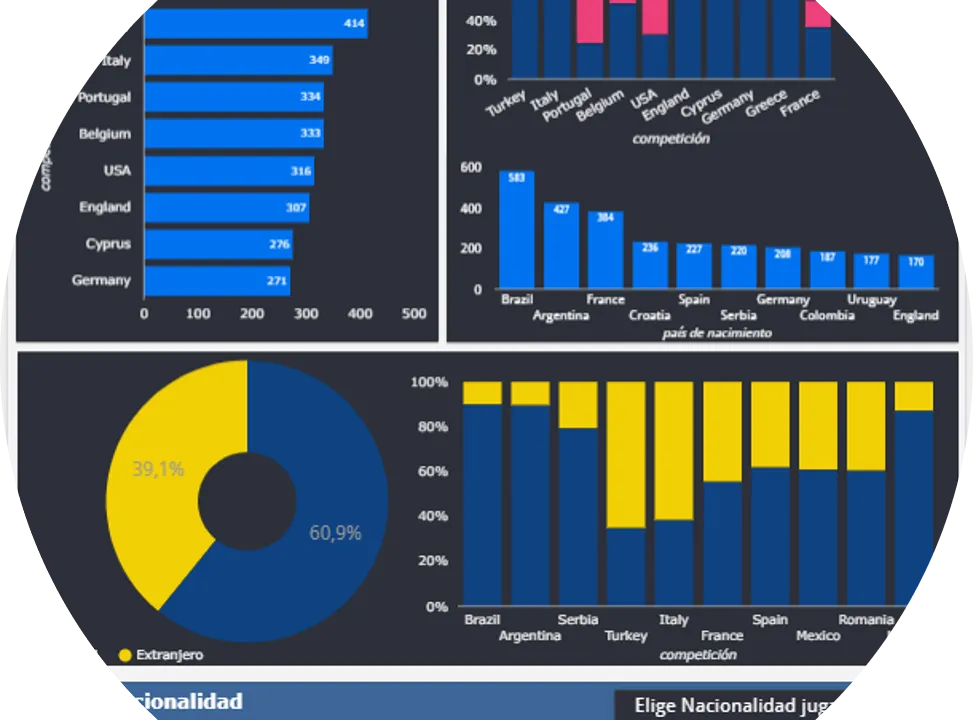
Agile and simple reporting
Infographics have been fashionable for years. They are a good way of representing information in a very visual manner, and very useful as a descriptive document when the aim is to explain a subject or a story easily and quickly. It is a simple representation that combines text and graphics, widely used, for example, in marketing, corporate presentations or events, but not so much for analysis or analytical reports. In this post we wanted to share our first data panel in the form of an interactive infographic. It is a tool that can serve as a template to generate an infographic by selecting the data that each user is most interested in, so that text can then be added to explain the data shown.
Explore the player market
Find out which leagues have the highest percentage of foreign players. Identify the most common destination for players from a given country, or how many different nationalities a competition has. This simple infographic is divided into two sections to segment the data: by competition or by the player’s country of origin or birth. Each section has a filter to select the data you are most interested in. The charts are interactive and interconnected, and also work as filters. Select several competitions and nationalities to make comparisons. Which competitions have the highest percentage of domestic players? What is the most common destination for Brazilian players? In which competition is the percentage of Africans highest?
The interactive infographic is not available in this version of the blog.
Alebia Sports Analytics is your ideal signing to get the most out of your data. Together we will travel the road to success, with simplicity, speed and pragmatism. Get in touch with us!