

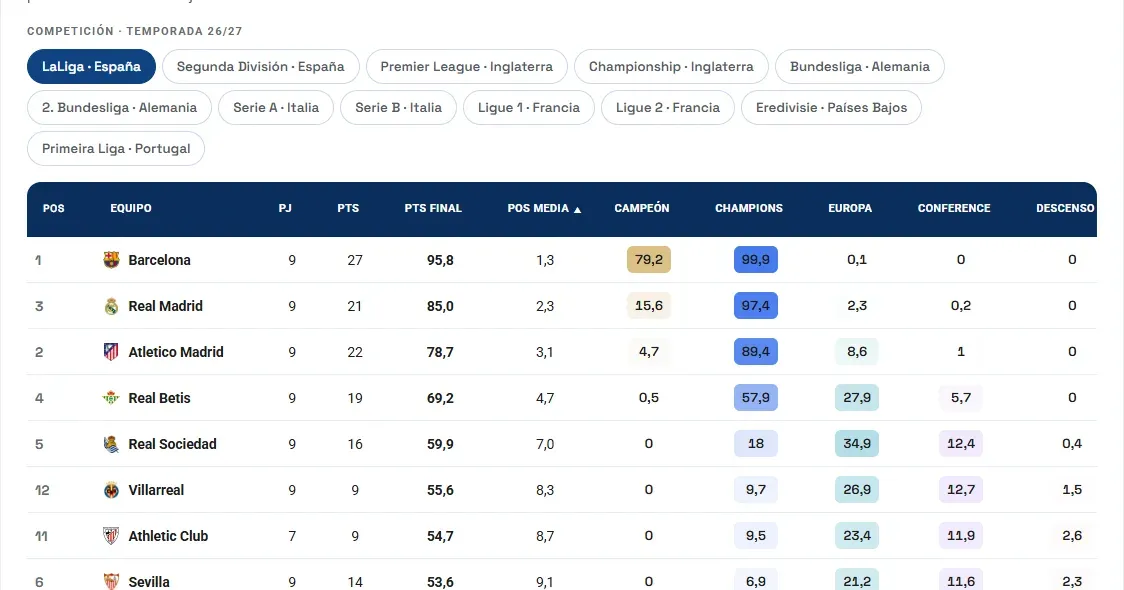
Today we are launching a new section on the site, the Data Lab, and we are opening it with a weekly league dashboard. It is a permanent, open and free page with data from the main European leagues, refreshed every week with our models. Team strength also covers the top divisions of Brazil, Argentina, Mexico and the USA.
It brings together three different readings of the same competition. Each one answers a question that every fan, and every sporting director, asks.
1. Team strength: how good is each side?
Every team gets a 0–100 rating that can be compared across leagues. It does not depend only on league position: it weighs what the team has done, against whom and how decisively. Next to the rating you will see how much it has risen or fallen over the last week and month, which is what matters most for spotting teams on a run or in decline.
2. Alebia Meritocracy: who “deserves” more than they have?
The real table records results; the Alebia Meritocracy records what would have happened if every match had been decided by expected goals (xG), that is, by the quality of the chances created and conceded. We compare points, wins, draws, losses, goals and position, real and expected. It is the always-up-to-date, weekly version of the merit table we measured for the Segunda División in 2020.
The key column is the points difference: real points minus expected points. A large positive figure means the team is collecting more than its play justifies, which often warns that the fixtures will put it to the test. A large negative one means it is being punished by bad luck and is a candidate to recover.
3. League forecast: where will it finish?
We simulate the rest of the season thousands of times. From that come the expected points at the end of the league, the average position and the probability (%) of each target: winning the title, reaching the Champions, Europa or Conference League, being promoted directly or via play-offs, playing the relegation play-off or going down. Only the zones that exist in each competition are shown. If you want to understand what is behind these percentages and why they should be read with care, we explain it in Big Data Predicts My Team Will Be Relegated… Should I Start Getting Used to the Idea?.
How to use it
Pick a competition, switch tabs and click any column header to sort. The data is refreshed every week, so it is worth coming back: the fun lies in watching how the probabilities move matchday after matchday.
And if your club needs this kind of analysis with its own competitions, metrics and branding, that is exactly what we build at Alebia: get in touch.